What every body fat percentage actually looks like
Slide through body fat percentages from stage-shredded to severely obese, men and women side by side, with what each level feels like to live at and where the healthy ranges sit.
Everyone has typed "what does 15% body fat look like" into a search bar at some point. The problem is that most charts disagree with each other, and real bodies disagree with the charts. Two people at the exact same percentage can look wildly different depending on how much muscle they carry underneath.
This guide covers the full spectrum for men and women, from stage-shredded to severely obese, drawing on DEXA-scan data popularized by Jeff Nippard's visual guide, where real people were scanned and interviewed at every level. Grab the slider below and walk the whole scale: for every stop you get what it looks like, what it feels like to live at, and whether it is a place worth staying.
Slide the scale
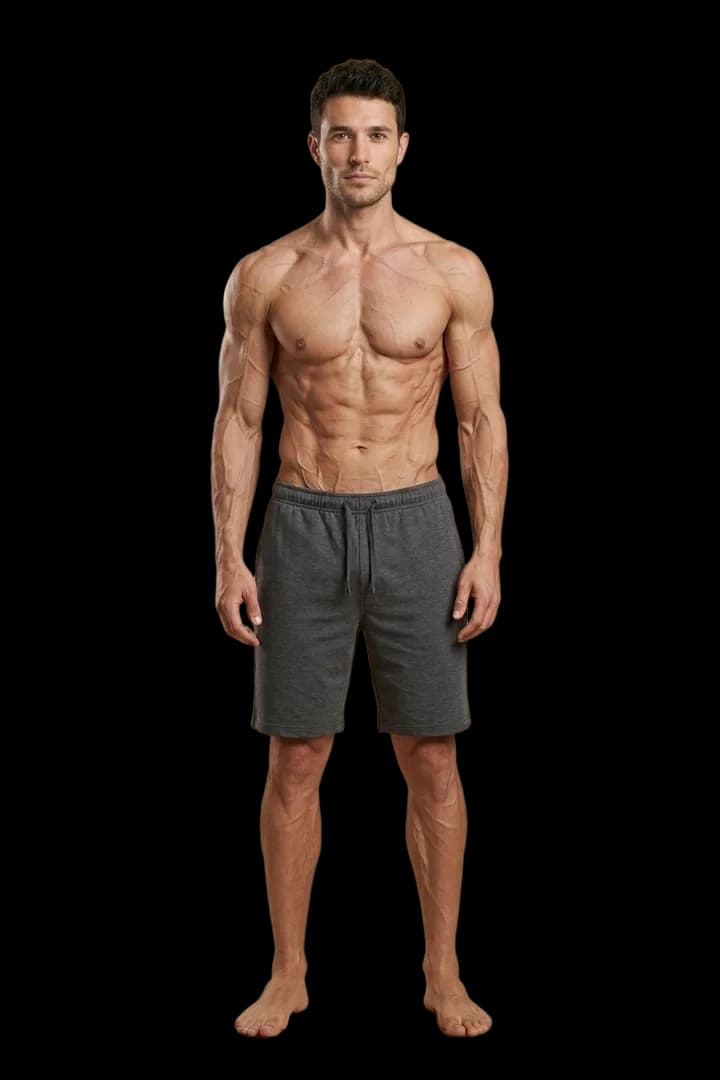
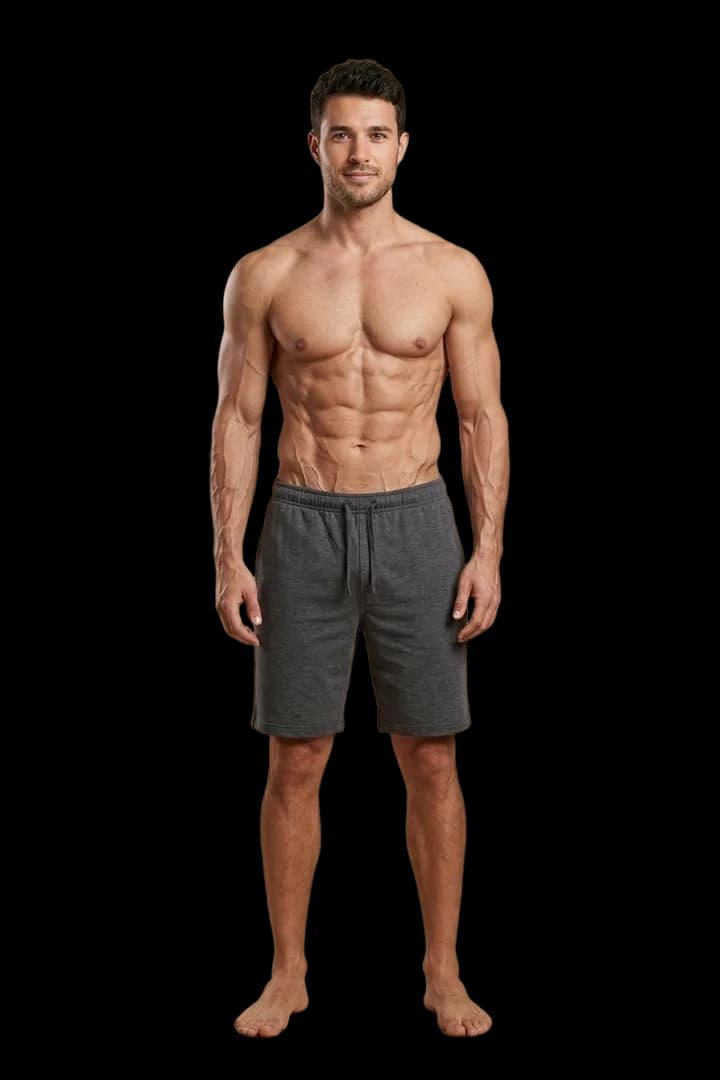
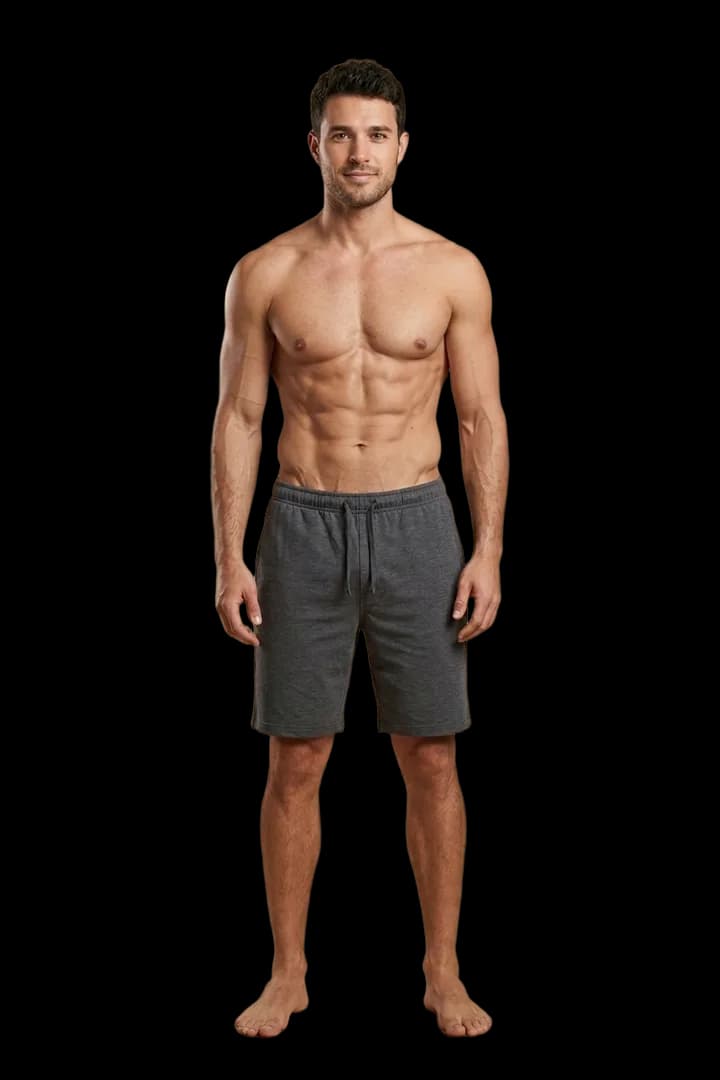
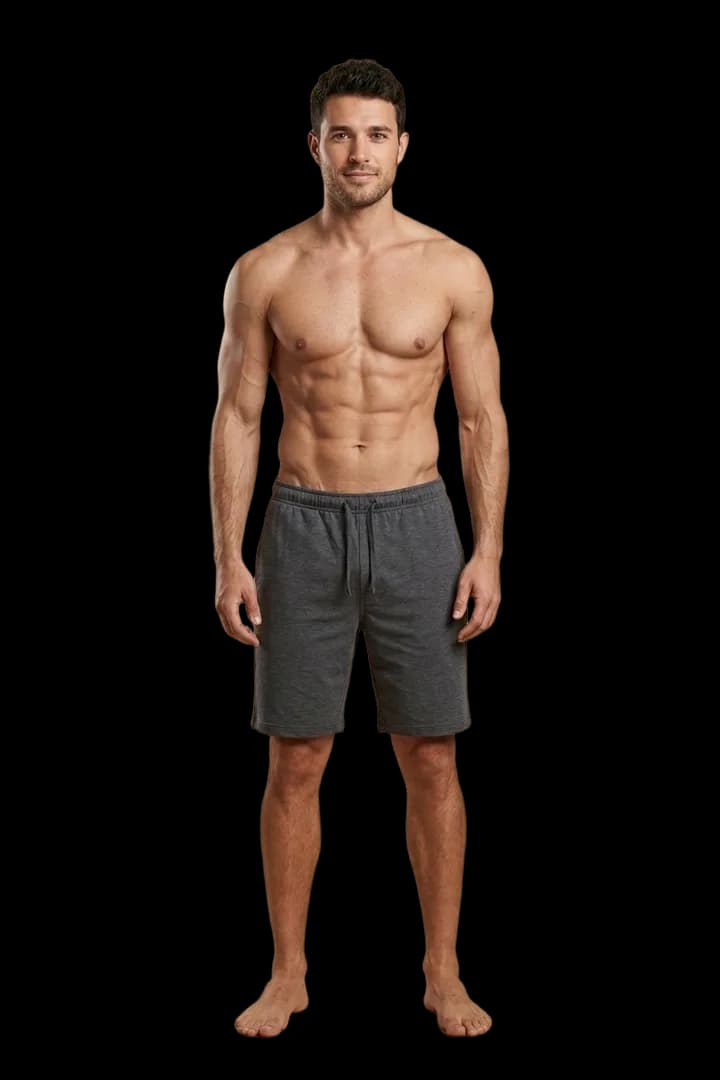
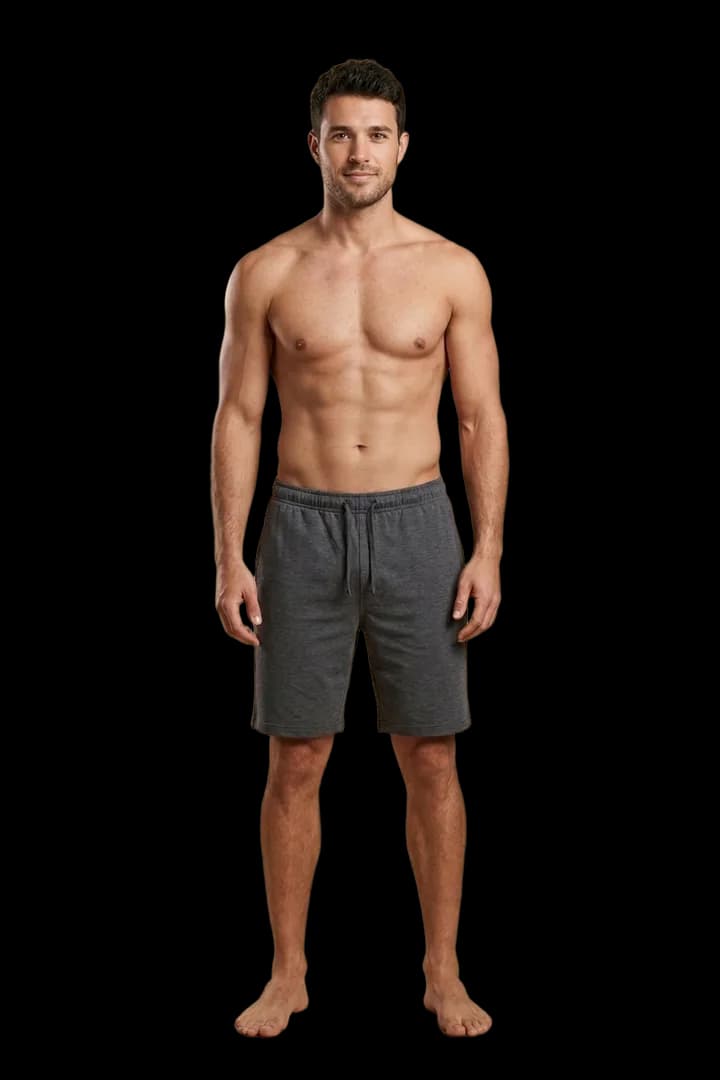
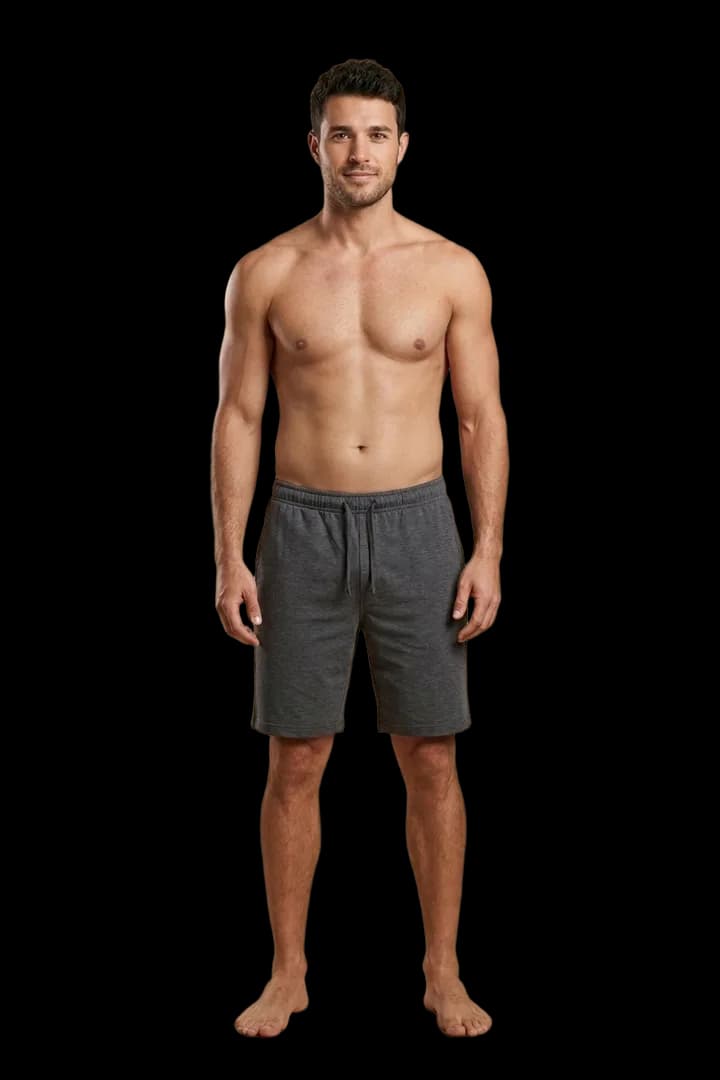
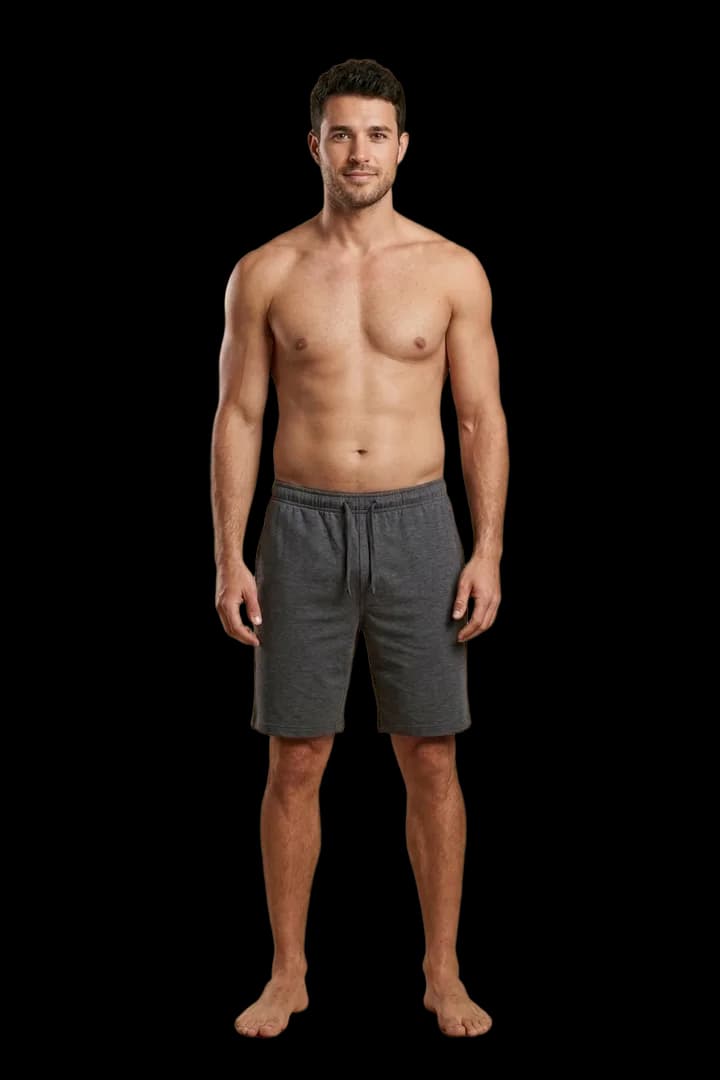
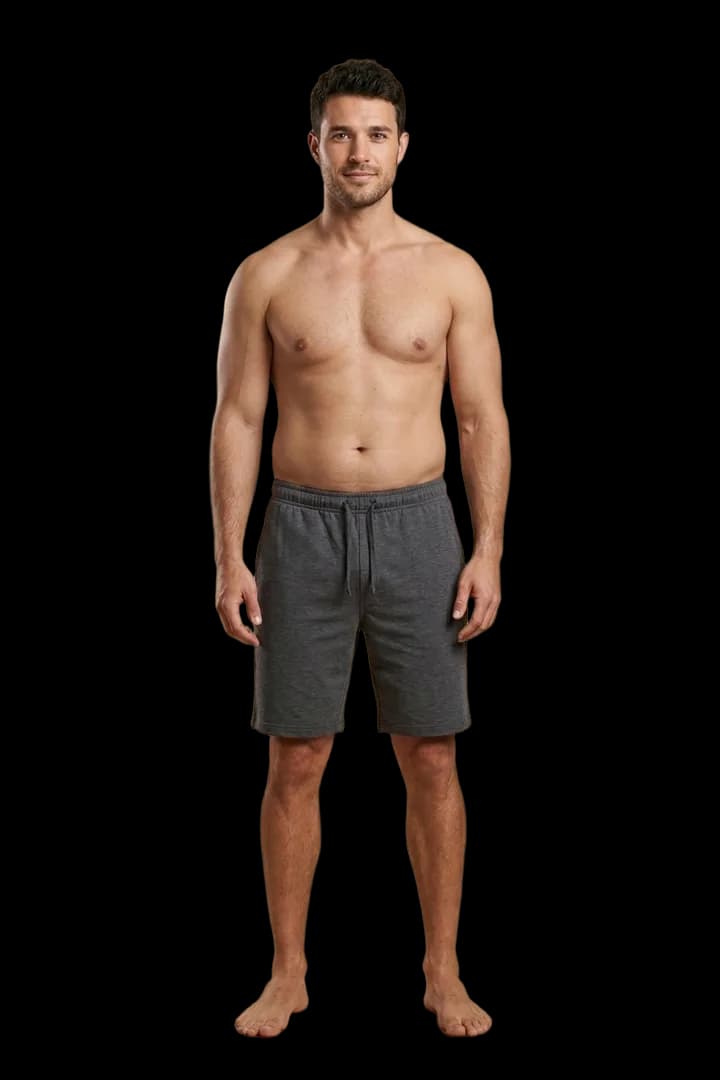
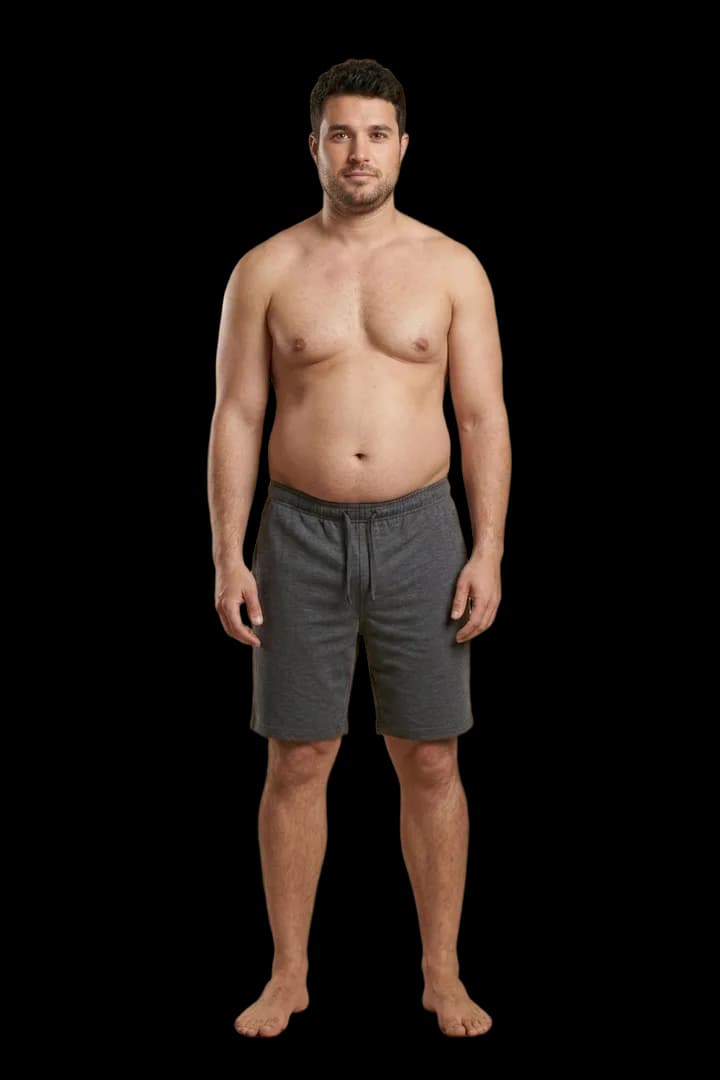
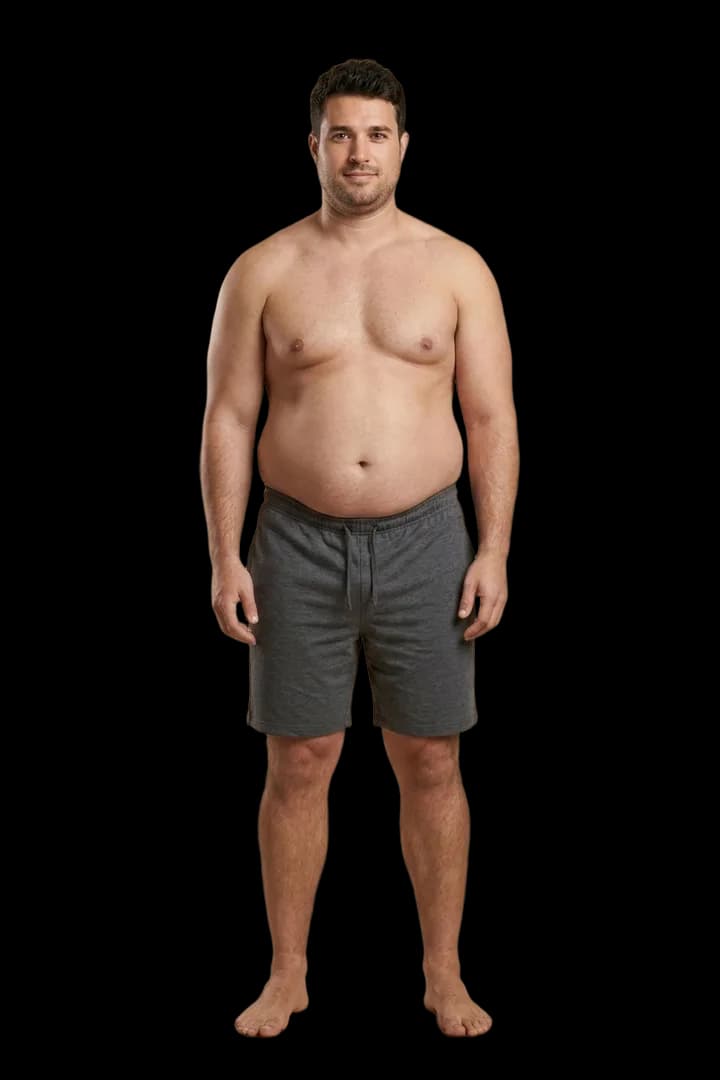
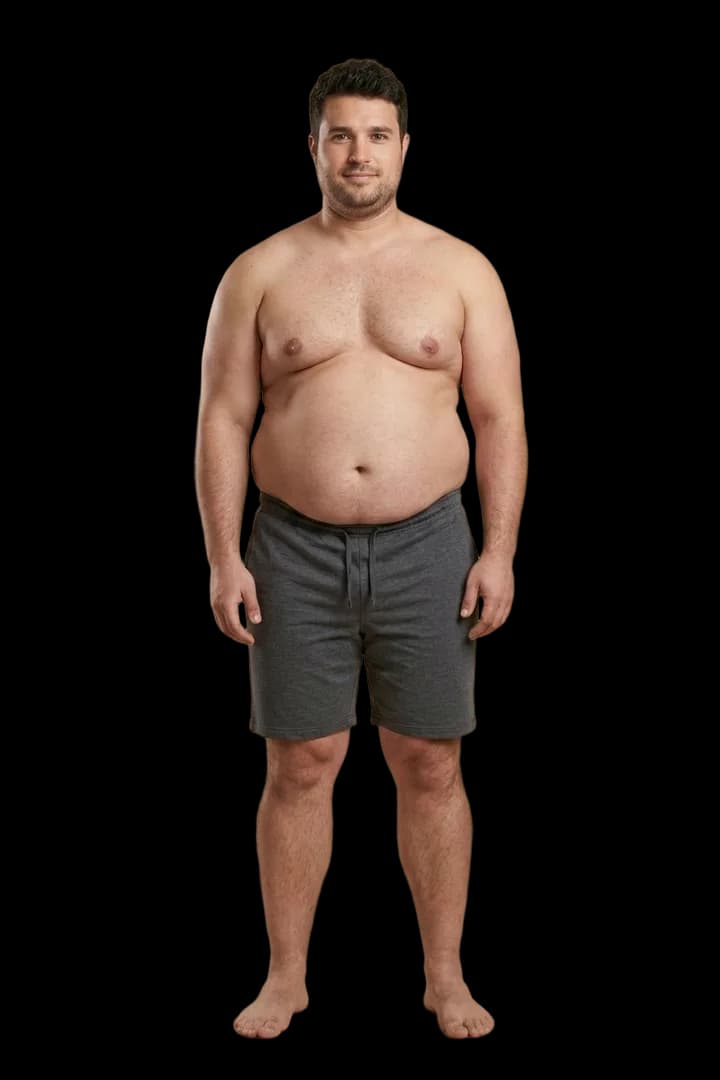
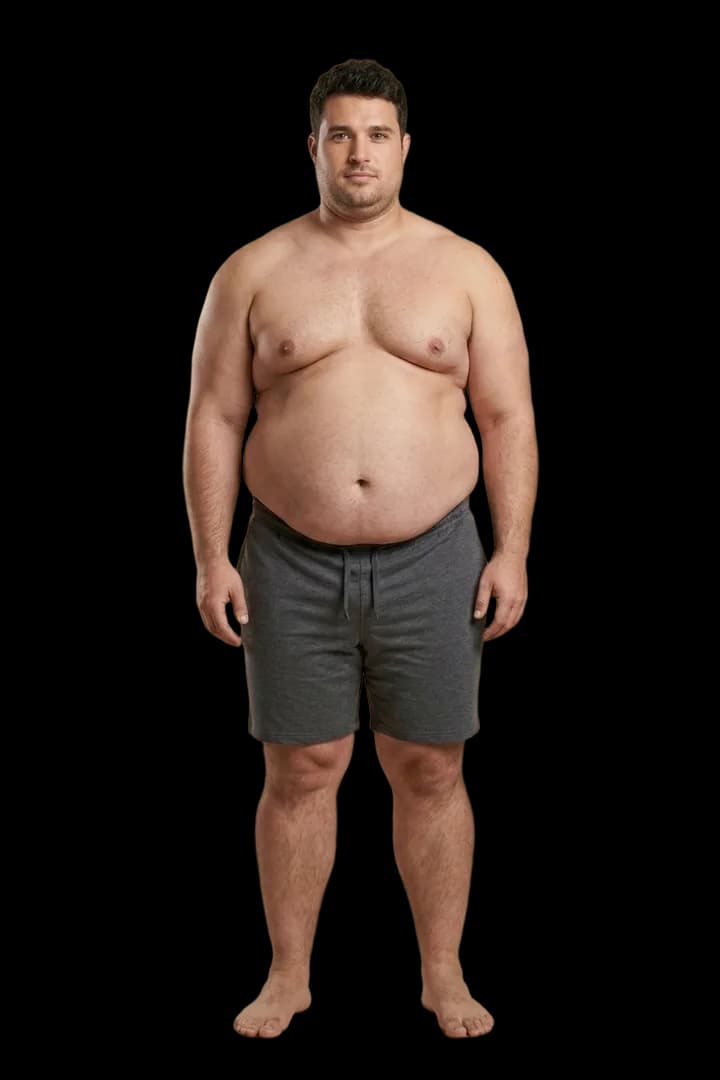
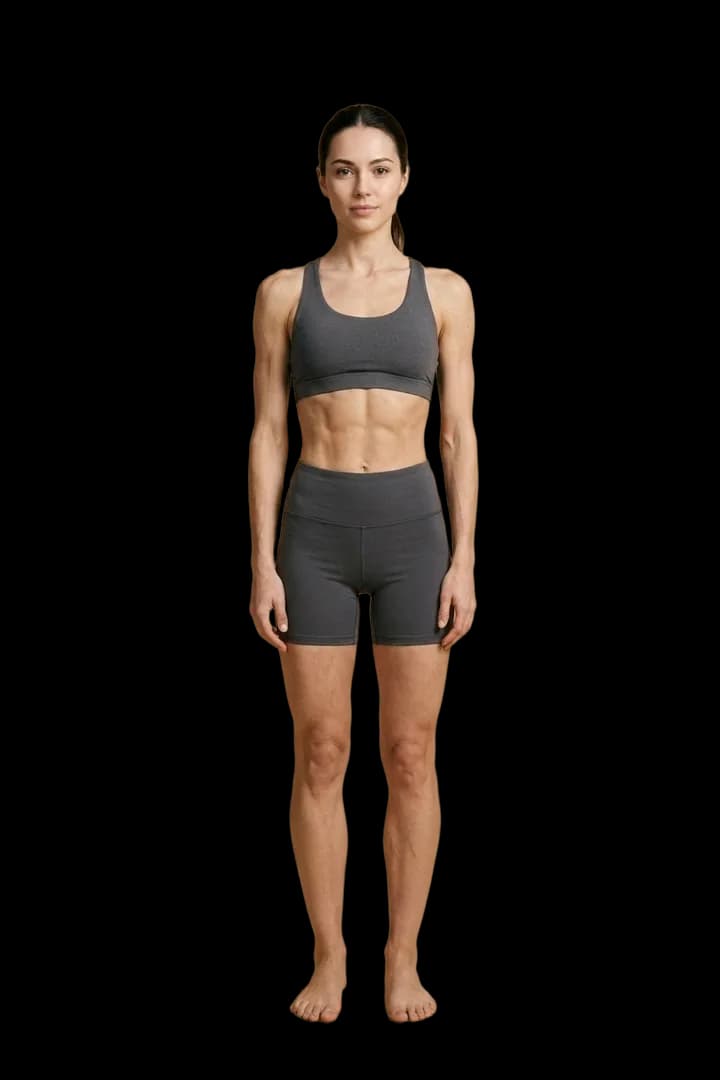
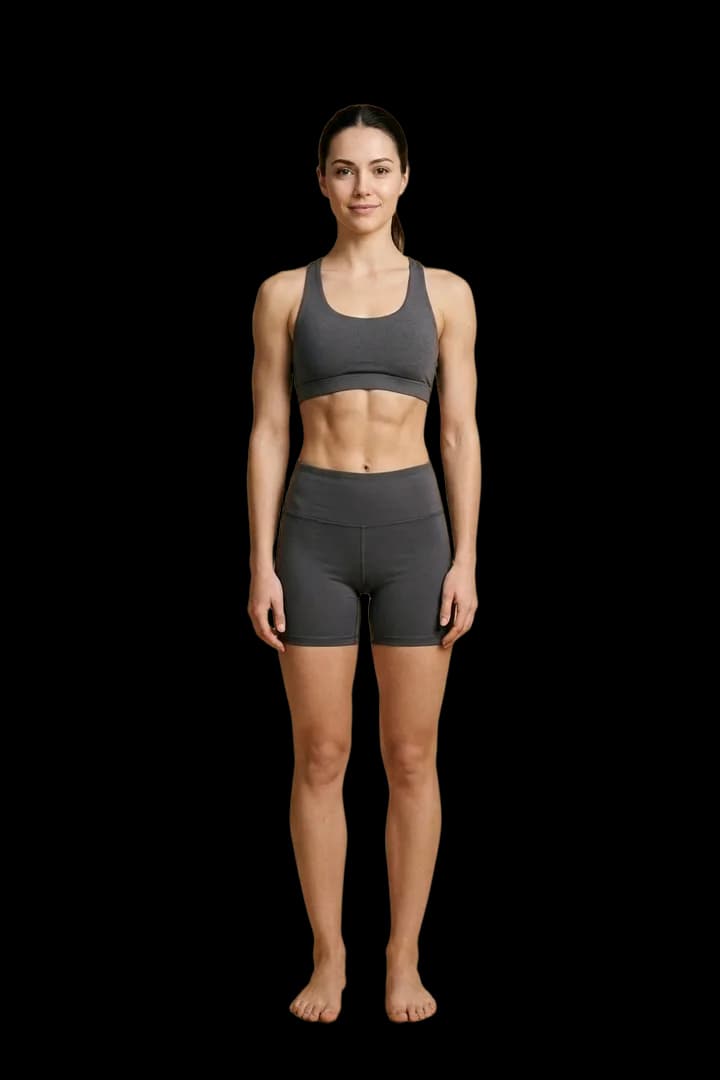
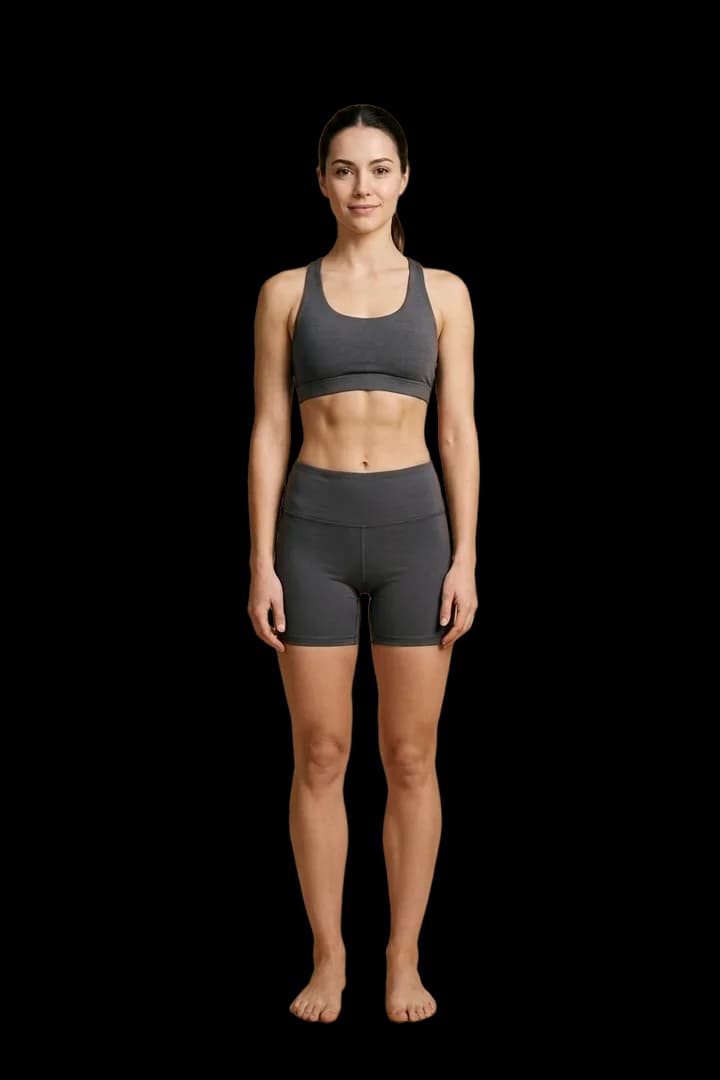
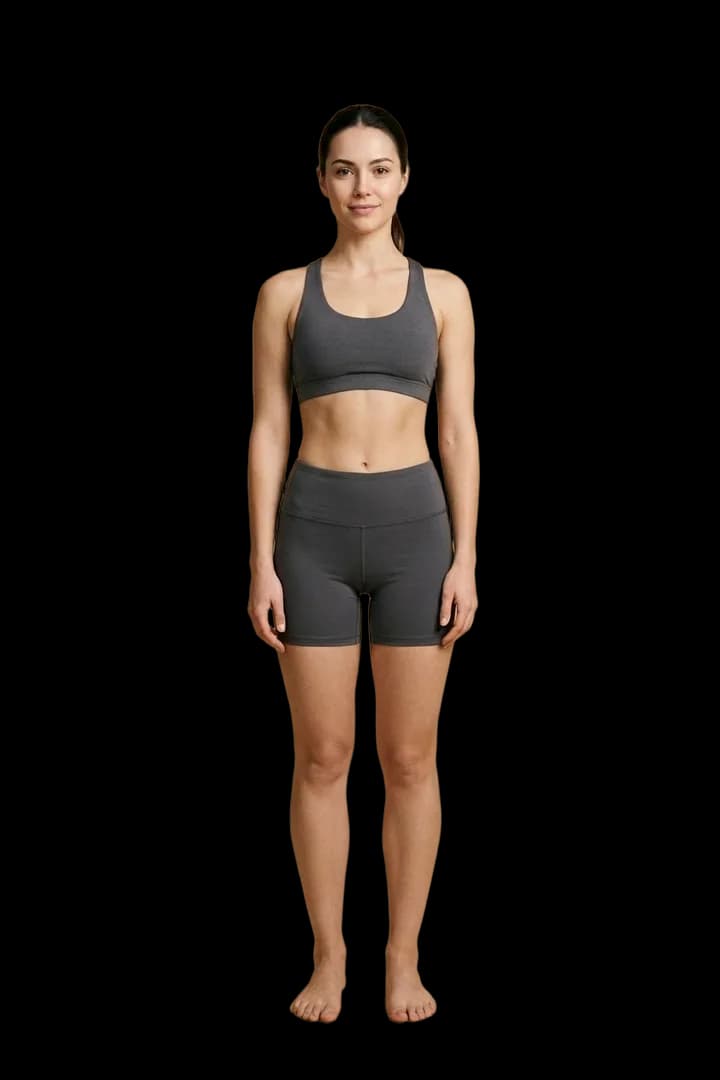
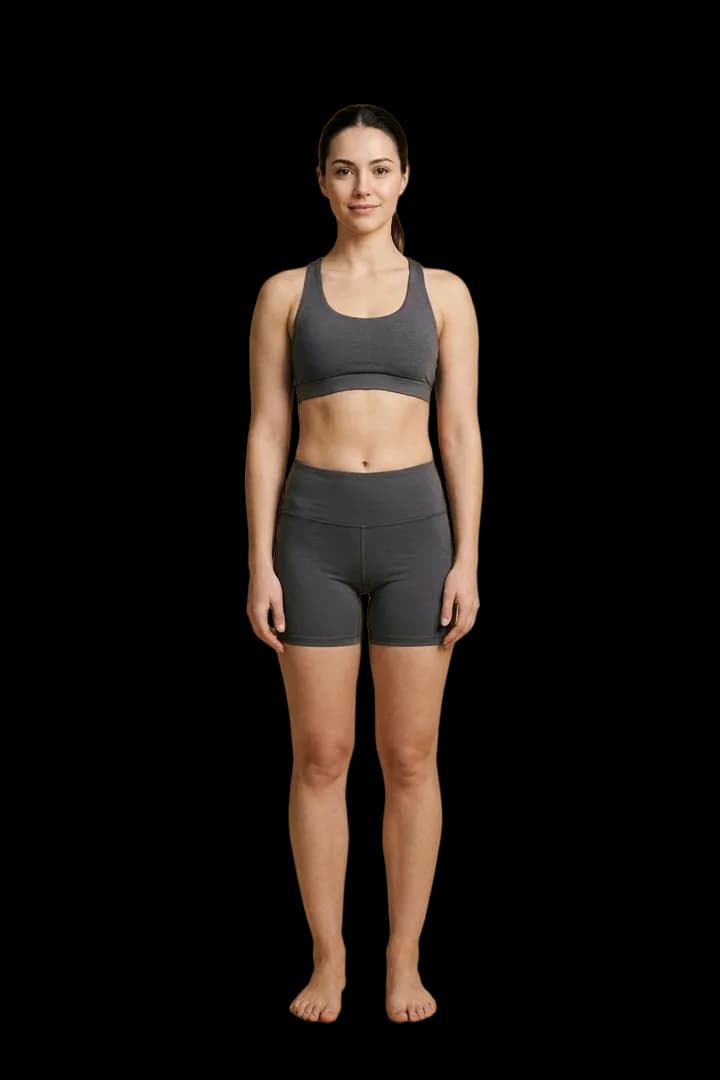
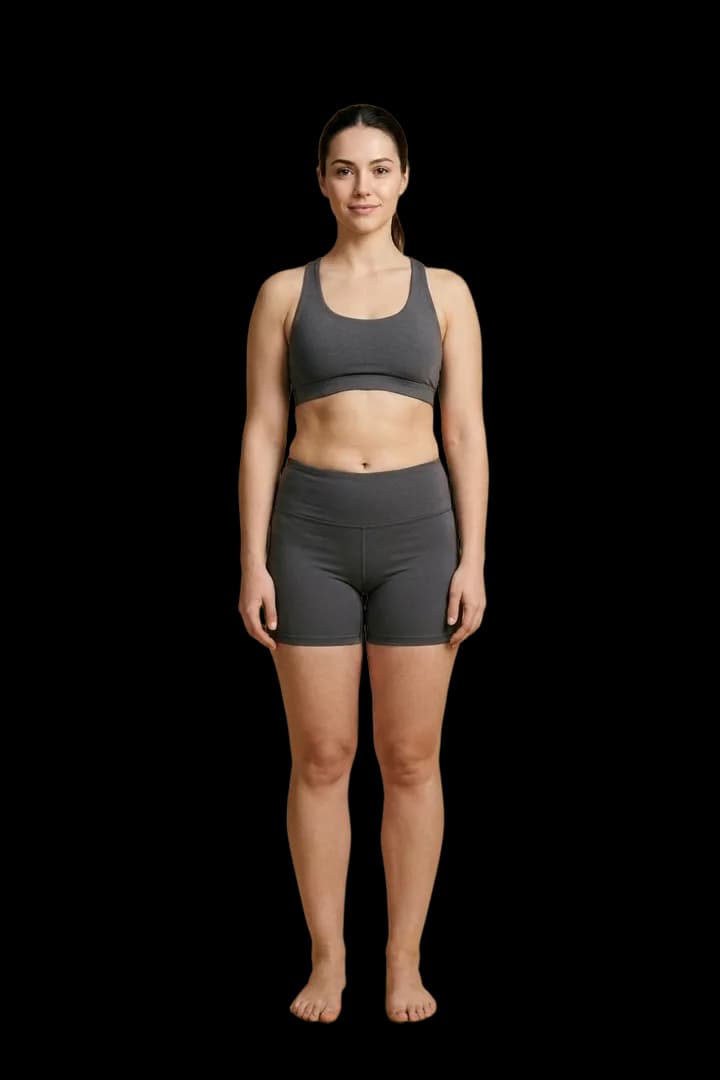
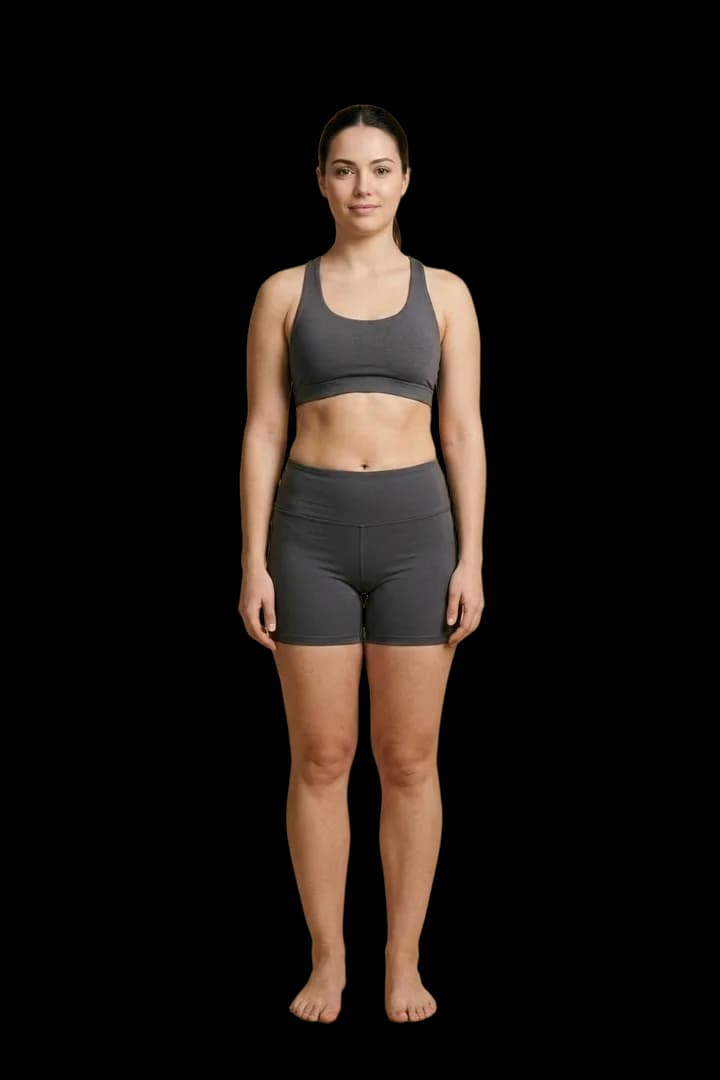
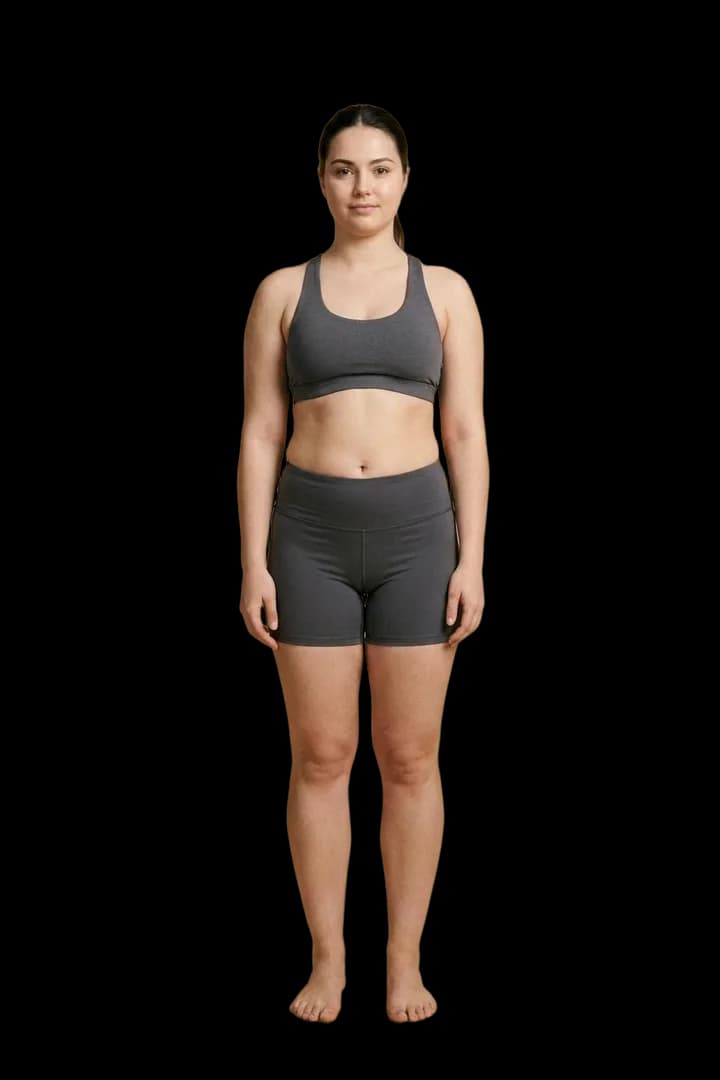
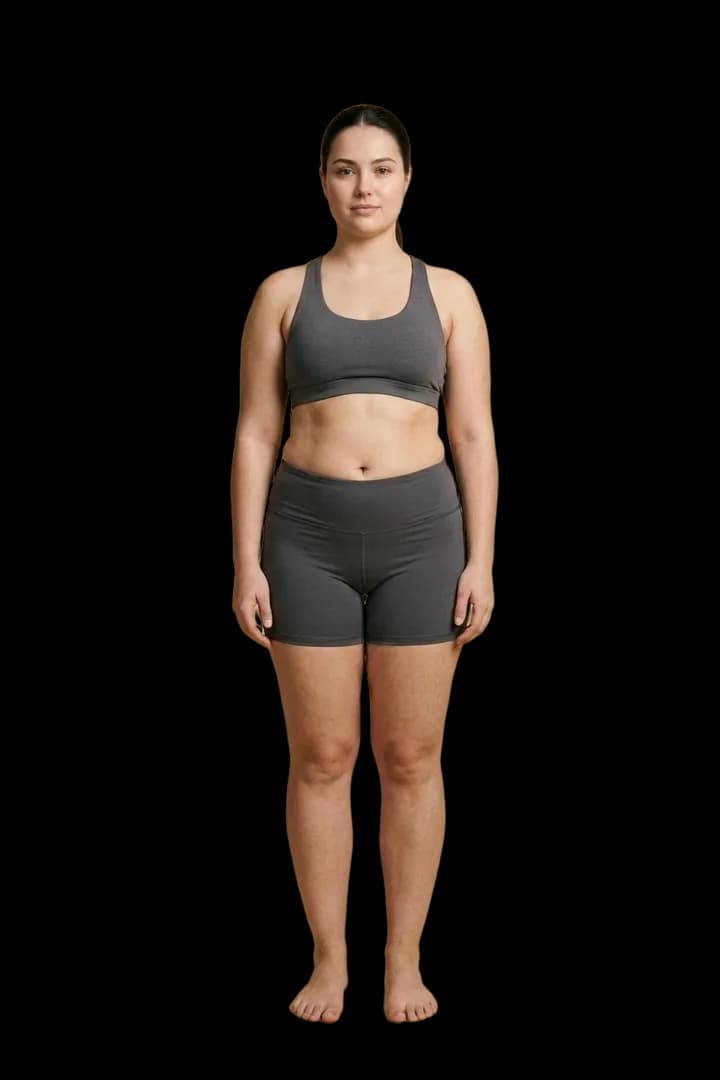
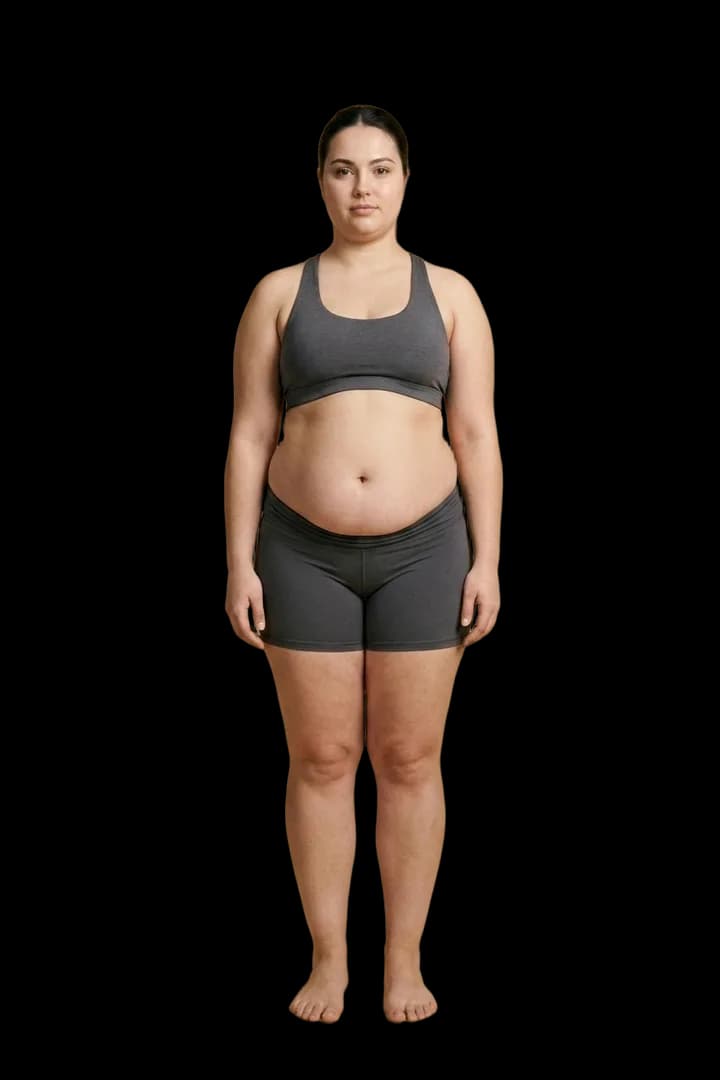
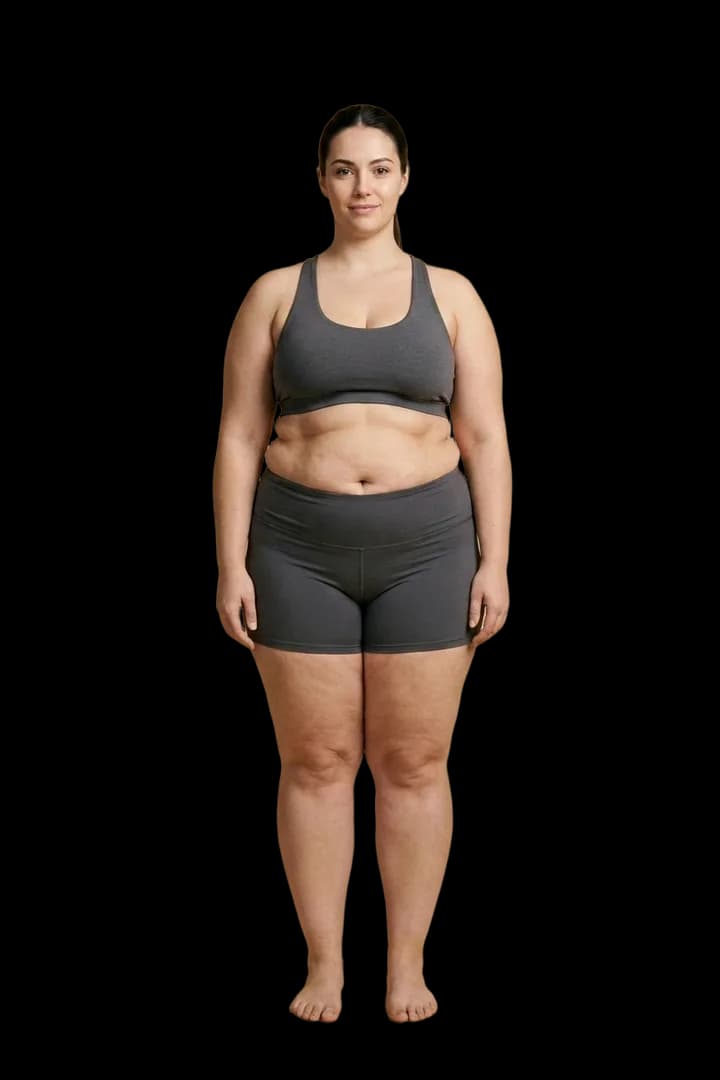
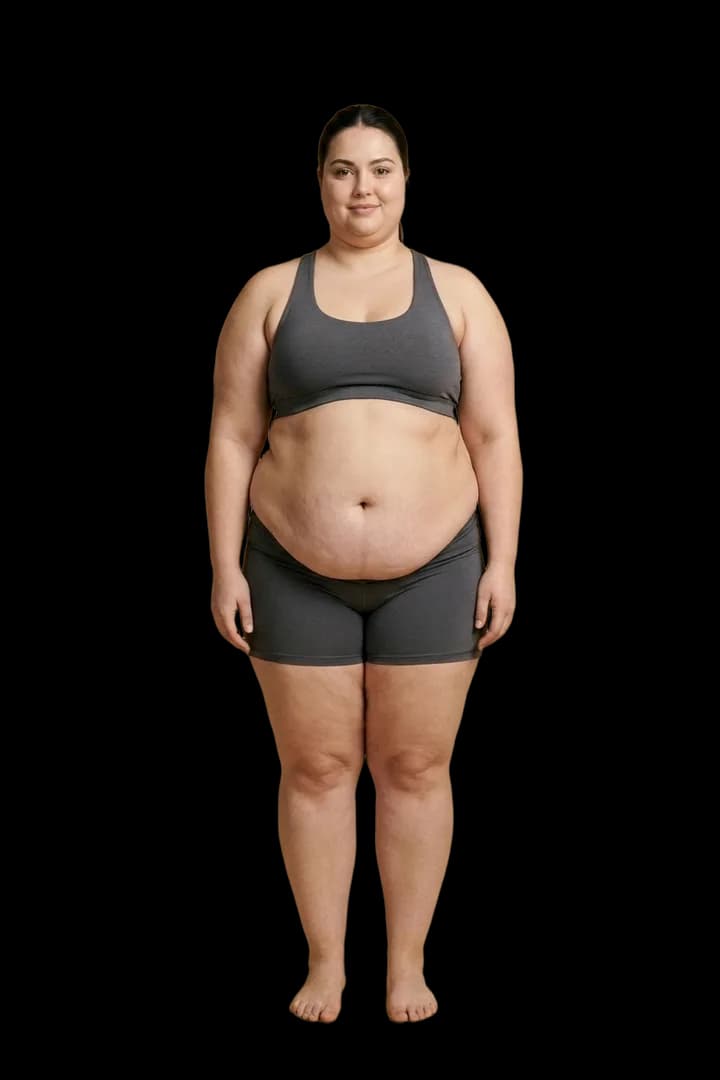
Drag the scale, or tap a number to jump
Soft but strong
A slight belly appears and definition fades, but shoulders and arms keep their shape. Fun fact from the DEXA data: a man with visible strength at about 20 percent body fat is still leaner than most of the population. Health markers here are usually fine when training stays consistent.
Fit and lean
Flat, toned stomach with light definition and full feminine curves. This is the level most "toned" fitness inspiration photos actually sit at, and unlike the ranges above it, it coexists happily with normal hormones, energy, and pizza nights.
What the number even means
Body fat percentage is simply the share of your total weight that is fat tissue. An 80 kg man at 15% carries about 12 kg of fat; everything else is muscle, bone, organs, and water. Some of that fat is essential: men need roughly 3%, women roughly 10 to 13%, to keep hormones and organs working. Everything above essential is storage.
Measuring it precisely is harder than it sounds. DEXA scans are the practical gold standard, calipers are decent in trained hands, and smart-scale readouts can swing several points with your hydration. Whatever tool you use, track the trend with the same tool under the same conditions and ignore any single reading.
So where should you actually aim?
| Category | Men | Women |
|---|---|---|
| Essential fat | 3 to 5% | 10 to 13% |
| Athletes | 6 to 13% | 14 to 20% |
| Fitness | 14 to 17% | 21 to 24% |
| Average | 18 to 24% | 25 to 31% |
| Obese | 25%+ | 32%+ |
Those are the classic ACE categories. The lived-experience version from the DEXA interviews lands in the same place: the sustainable sweet spot where you look athletic, perform well, and still have a life is roughly 10 to 22% for men and 20 to 32% for women. Leaner than that buys visual sharpness with hunger, hormones, and social flexibility as the currency.
How to change your number
Dropping body fat is a calorie game plus a muscle game. Find your daily burn with the TDEE Calculator, eat about 20% below it, keep protein high, and lift so the weight you lose is fat rather than muscle. The mechanics are covered in calorie deficit vs surplus and Macros 101.
Expect roughly 0.5% of body weight lost per week on a sensible cut, which translates to about one body fat percentage point per month for most people. Slower than the internet promises, faster than doing nothing, and it compounds.
FAQ
Keep learning
What is TDEE?
TDEE is your estimated total daily energy expenditure: the calories you burn in a day.
Calorie deficit vs surplus
Cutting and bulking come down to eating below or above maintenance in a sensible way.
Macros 101
Macros are protein, carbs, and fat: the nutrients that make up most of your calories.